Greenhouse IoT Project – Part 4 – Get data flowing
I finally managed to get my Home Assistant and ESPHome up and running. That’s awesome. Now we need to involve Azure somehow. But first we actually need another piece of hardware. We need to hook up a temperature sensor! Yeah, let’s start there.
Solder on!
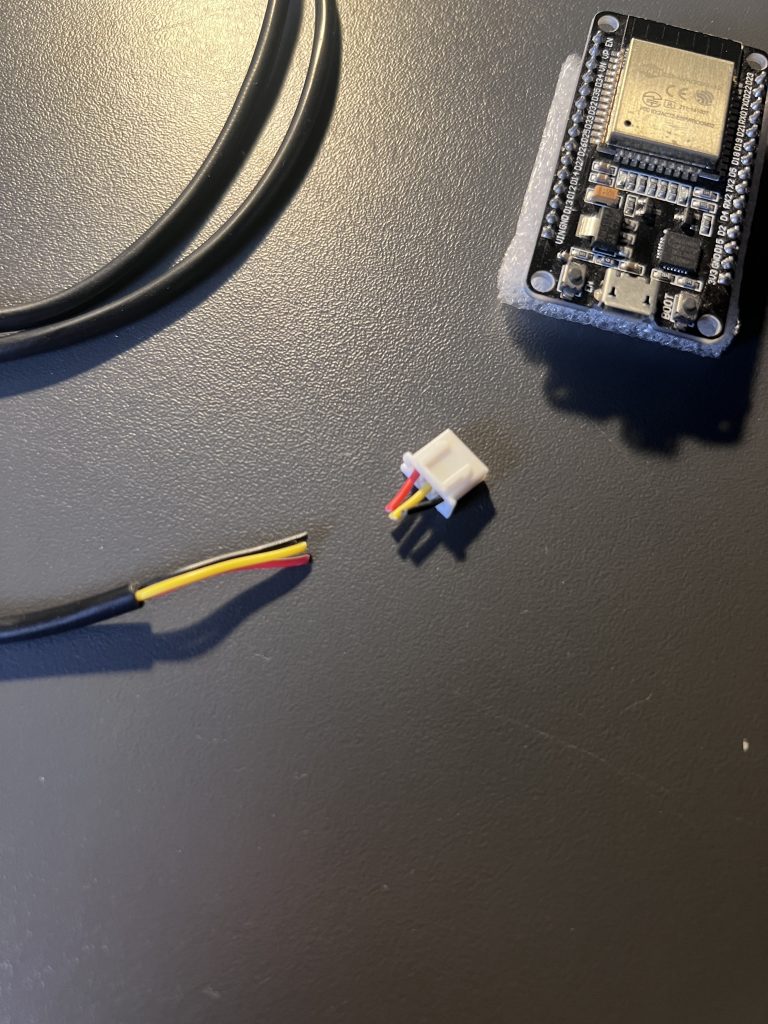
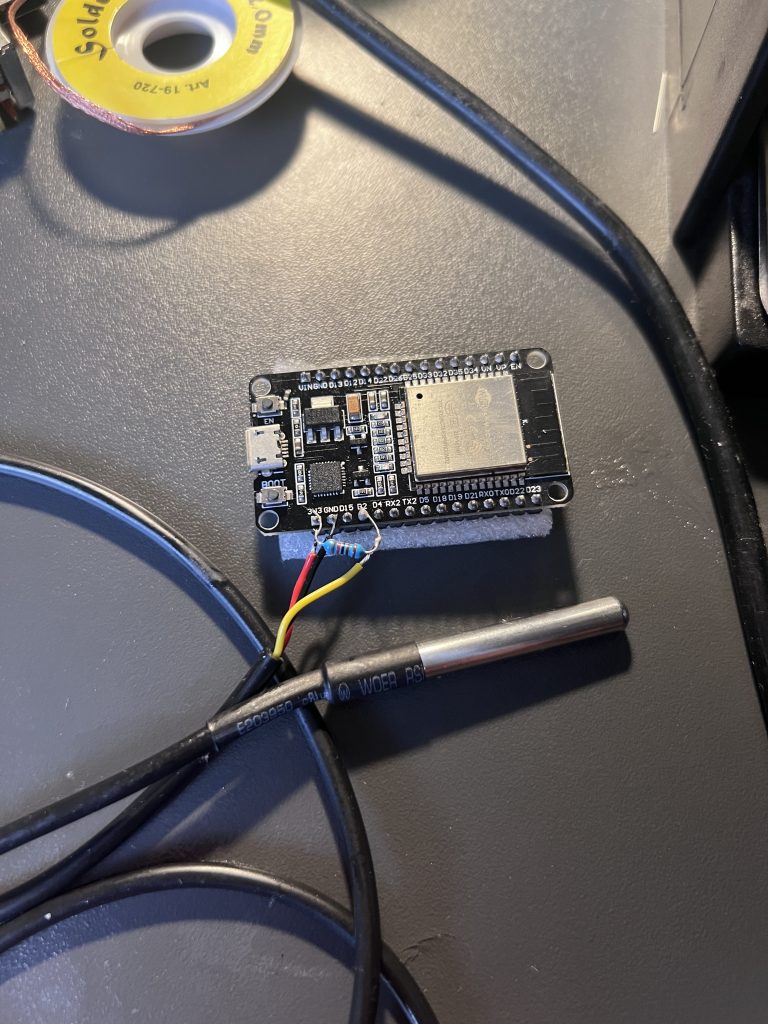
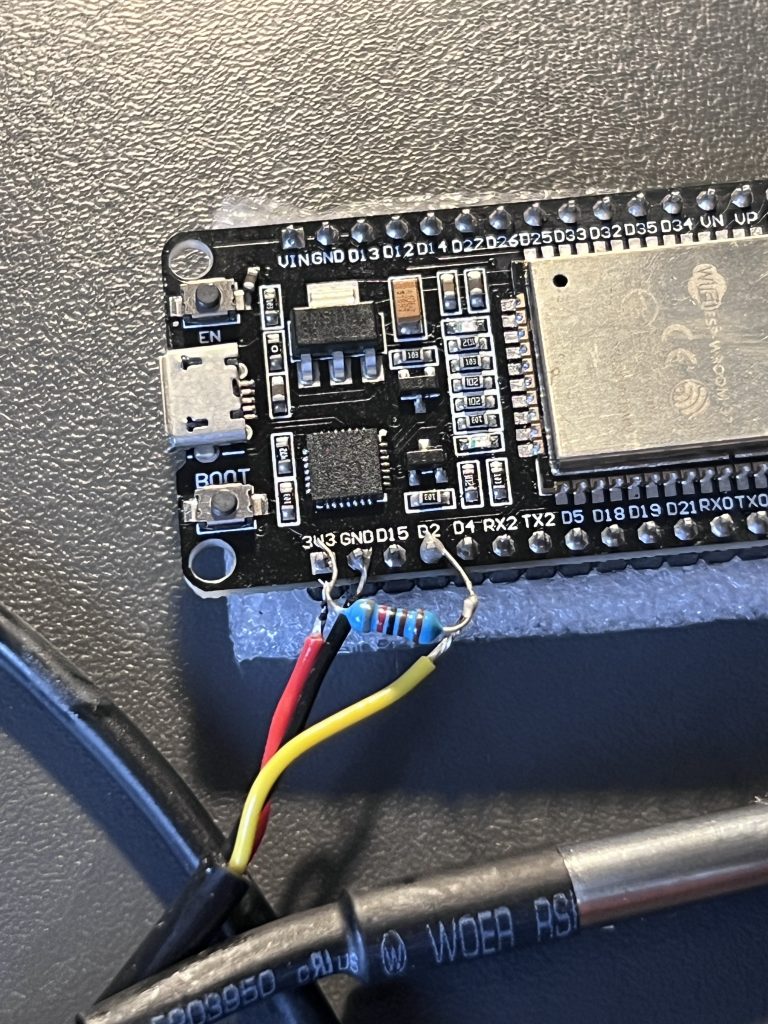
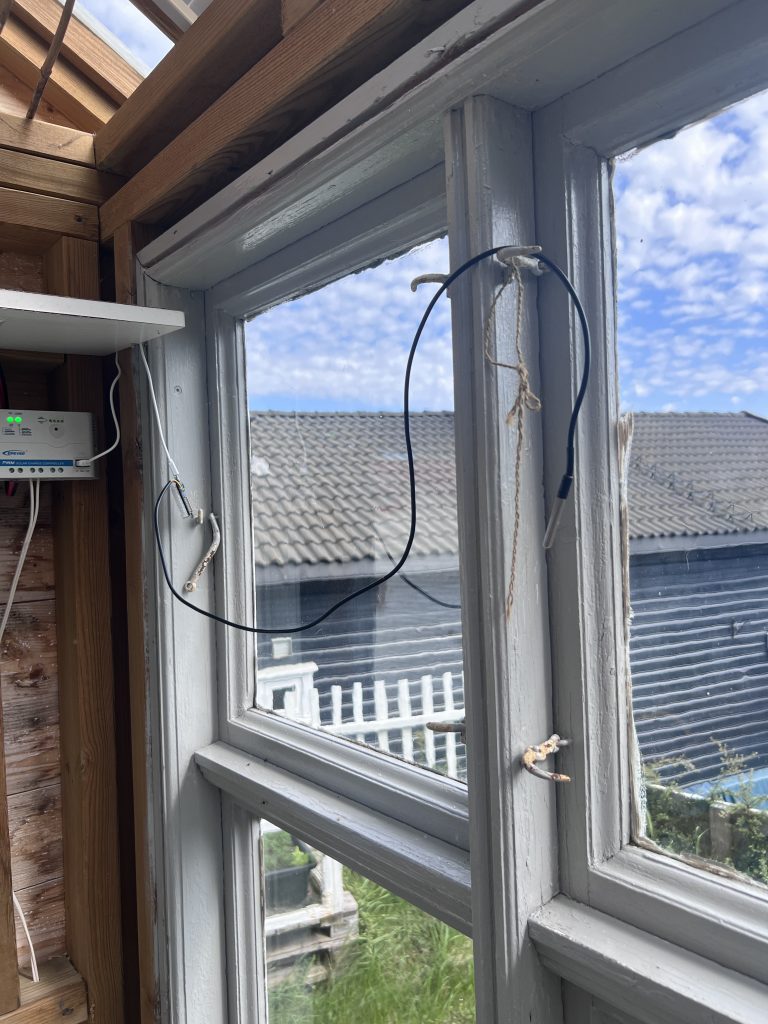
I bought a sensor called Dallas DS18B20 off of eBay. This sensor needs 3.3 volt, ground and a connection to a data line. The ESP32 has pins for all of this. I used dataline 2 (GPIO02). Hooked it up with a resistor with 8,2Kohm between the data line and 3.3volts. This is to get a more correct reading (some sort of a baseline voltage), if I understand it correctly. Soldered it together and put it out in the greenhouse. I’ll get a housing and a better solution for this later, but it’s all for proof of concept as of now
Configure the sensor
Next we need to let ESPHome know of it’s presence. In the config file for my EPS32 in the ESPHome dashboard, I can click on edit and type in this YAML code to load the correct config. We actually need to do this in two steps, because we need a sensor address to input, and we don’t know what that is before we trigger the «DallasComponent».
dallas:
  - pin: GPIO02
So, save the file and reupload the software wirelessly. This will compile, upload and then reboot your ESP32. Take a look in the logs, and you should be able to see it has found the sensor and what address it has.
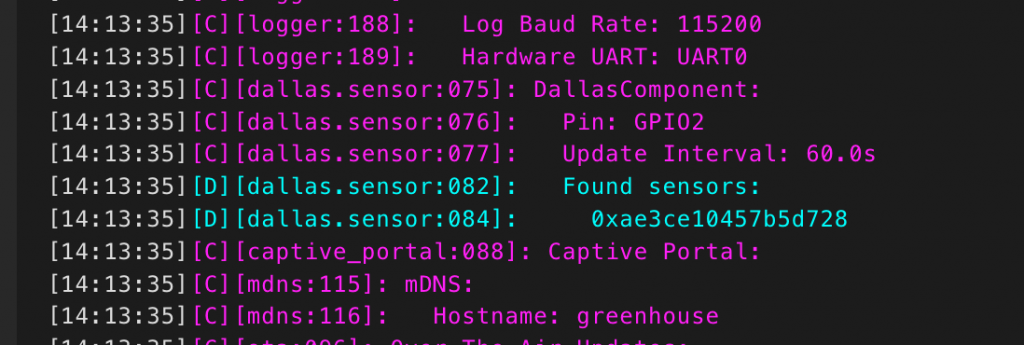
Copy this string and use it in the configuration of the sensor. This should be your final result. Here you first set up the Dallas component, then reference it in the sensor component, what address it has and what you want it to be called:
dallas:
- pin: GPIO02
sensor:
- platform: dallas
address: 0xae3ce10457b5d728
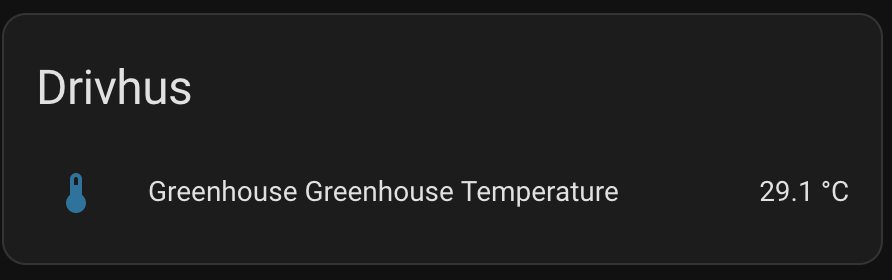
name: "Greenhouse Temperature"Another compile, upload and reboot later: voila! My Greenhouse is now connected to HA and displaying the actual temperature. Cool! Or hot… I guess it depends.
Create Azure resources
So on to the next part! Since I want HA to push this data to Azure, we need to prepare a couple of things. Before we can add Azure Event Hub integration to HA, we need to deploy some resources to Azure. Got your Azure account ready? Good! I’ve created this Bicep-script for you so your resources will be setup as they should. I prefer to use Azure CLI via VScode. Read more on Azure CLI here: https://learn.microsoft.com/en-us/cli/azure/authenticate-azure-
Authenticate with Azure:
az loginCreate your resource group. Give it a name and location:
az group create --name rg-iot-drivhus --location norwayeastThe full Bicep-code. It deploys two resources: One Eevnt Hub namespace, and the Event Hub itself:
@description('Specifies a project name to work under and gives a name to your resrouces')
@minLength(3)
param projectName string

@description('Provides a location for you resources based on your resource group')
param location string = resourceGroup().location

@description('Specifies the SKU for Event Hub Namespace')
@allowed([
  'Basic'
  'Standard'
])
param eventHubSKU string = 'Basic'

var eventHubNamespaceName = 'ns-${projectName}'
var eventHubName = 'eh-${projectName}'

resource greenhouseEventHubNamespace 'Microsoft.EventHub/namespaces@2023-01-01-preview' = {
  name: eventHubNamespaceName
  location: location
  sku: {
    name: eventHubSKU
    tier: eventHubSKU
    capacity: 1
  }
  properties: {
    isAutoInflateEnabled: false
    maximumThroughputUnits: 0
  }
}

resource greenhouseEventHub 'Microsoft.EventHub/namespaces/eventhubs@2023-01-01-preview' = {
  parent: greenhouseEventHubNamespace
  name: eventHubName
  properties: {
    messageRetentionInDays: 1
    partitionCount: 1
  }
}
Deploy it with this command. Take note of the parameter «projectName». This can be whatever you need it to be.
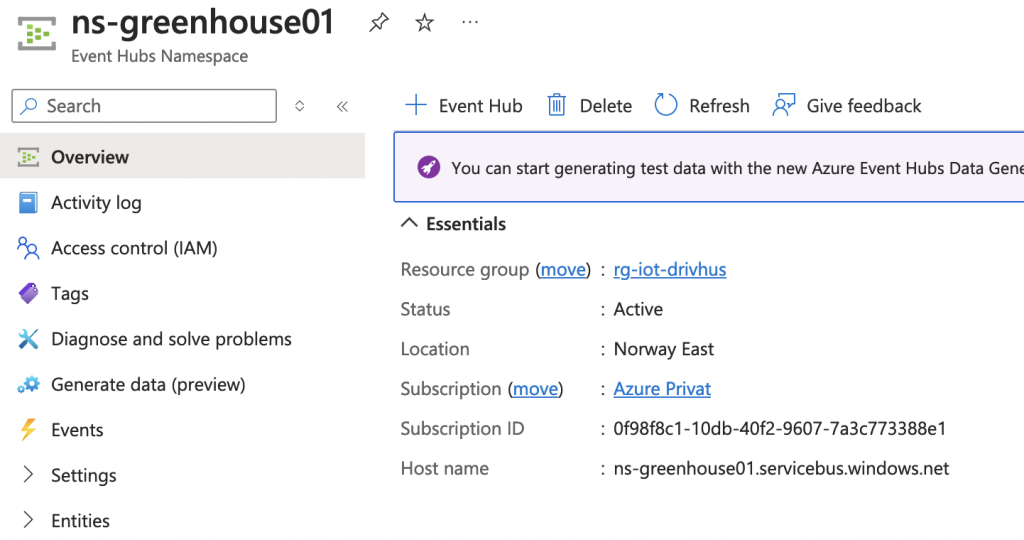
az deployment group create --resource-group rg-iot-drivhus --template-file EventHub.bicep --parameters projectName=greenhouse01After a while, they are available in Azure
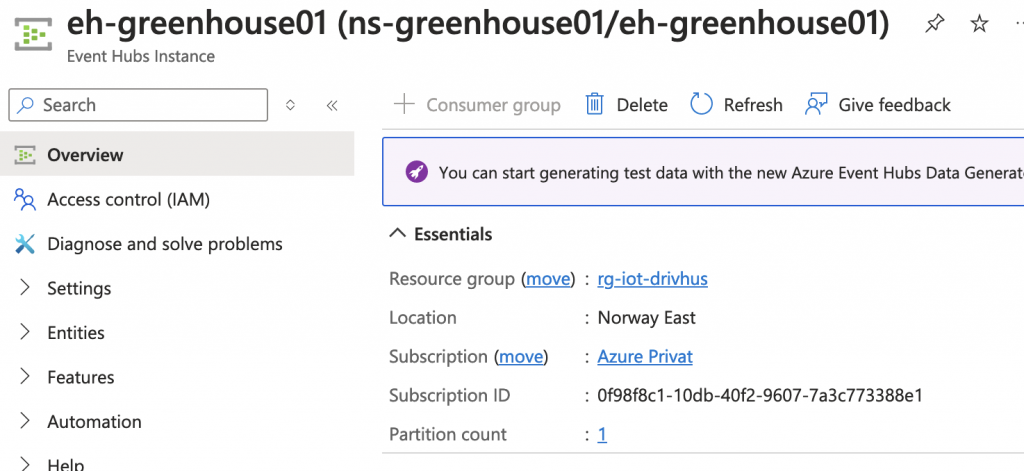
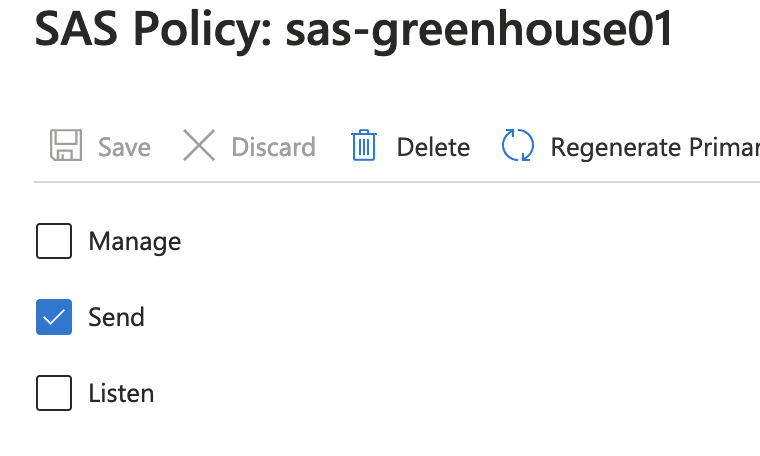
The last thing here is to create a SAS Policy with «Send» permissions, so we can send data to the Event Hub.
Once you have the name of the namespace, Event Hub instance name SAS Policy and the key, you can go on and setup the integration in HA.
Add Azure Event Hub to HA
To setup Event Hub, click this link here: Start configuration
The first thing you have to input is your Event Hub name. Click «Submit»:
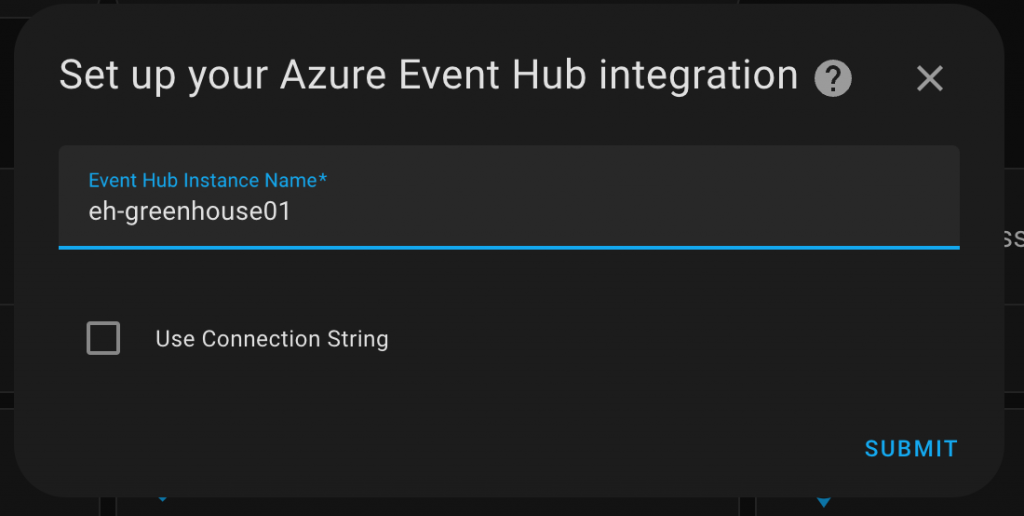
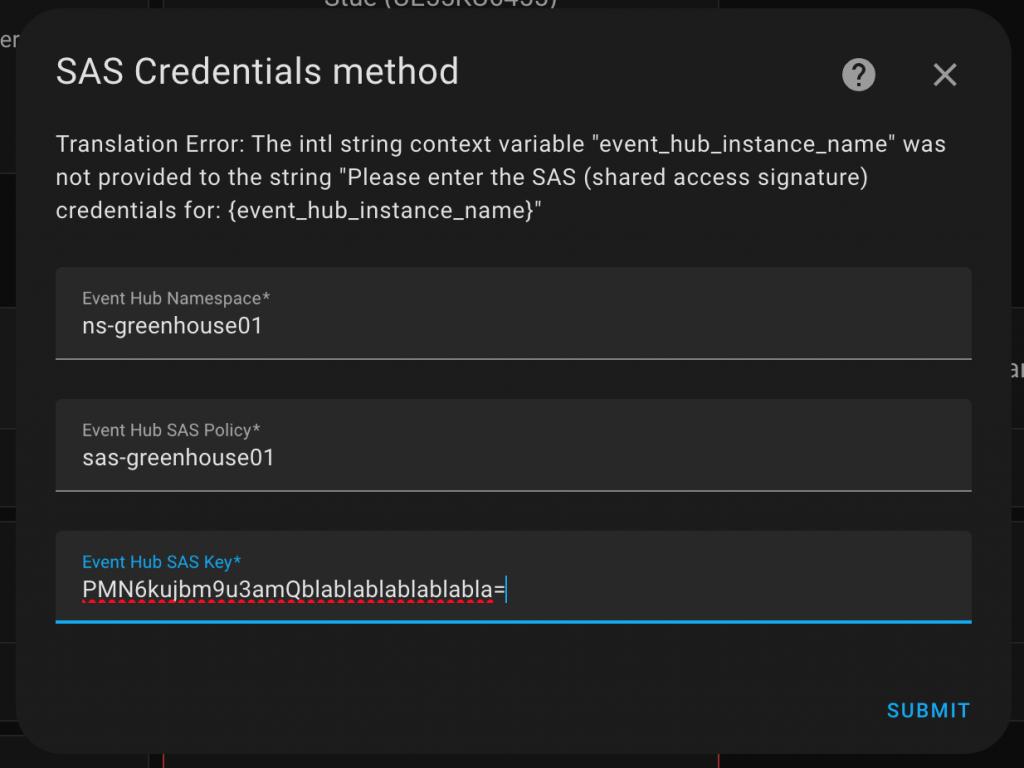
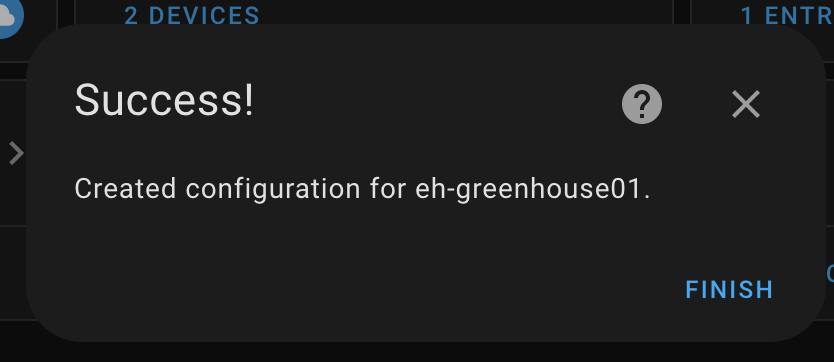
Next you copy in the namespace, SAS Policy and your key. Click «Submit», and then «Finish» and you’re done!
Admire your work!
Isn’t it lovely to se all that data flowing in? A sense of fulfillment? I know… Look at all these graphs showing all that data:
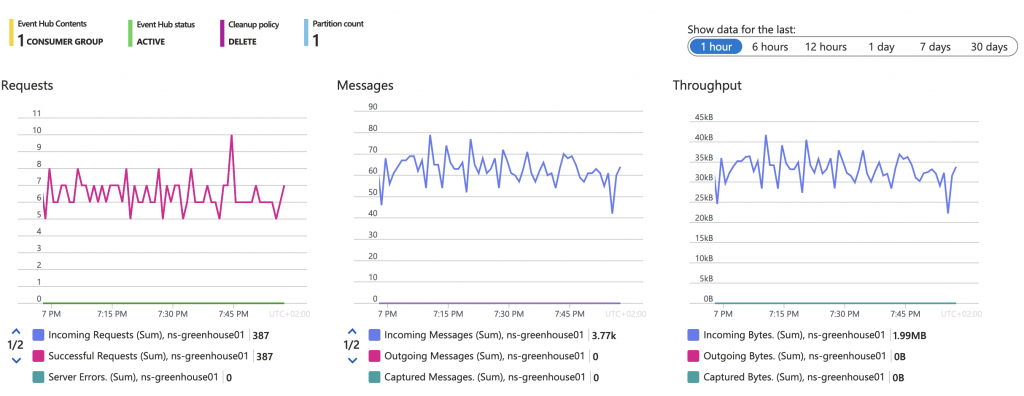
But is it a bit much data, eh? This is because HA now sends ALL the data from all of my sensors via Event Hub. To filter, you have to edit the Configuration.yaml-file and add a filter like this:
azure_event_hub:
  filter:
    include_entity_globs:
      - sensor.greenhouse_greenhouse_temperature
This will send only the included sensor data to the cloud, and nothing else. But it’s still a bit much for what I need. Therefore we can slow down the readings from the sensor to every 5 minutes so the amount of data points are kept to a minimum. The final YAML-code for the sensor in ESPHome will look like this:
sensor:
  - platform: dallas
    address: 0xae3ce10457b5d728
    name: "Greenhouse Temperature"
    filters:
    - throttle: 300s
Next we need to slow things down from HA to Azure. You can configure this under Integration entries in the integration. The default is 5 seconds. So it sends data every 5th second. We need it to send every 5th minute, so bump it up to 300.
Now we will read the temperature from the greenhouse every 5th minute, and send data from HA to Azure every 5th minute. More than enough to have a nice graph! Oh, talking about graphs. I use Azure Data Explorer to look at my data to ensure they are correct.
Azure Data Explorer
Azure Data Explorer is a free data exploration and analytics service. Azure Data Explorer is fully managed, scalable, secure, robust, and enterprise-ready. It’s useful for log analytics, time series analytics, IoT, and general-purpose exploratory analytics. Read more here: https://azure.microsoft.com/en-us/products/data-explorer
First, go to https://dataexplorer.azure.com and create your own FREE cluster to start ingesting your data to:
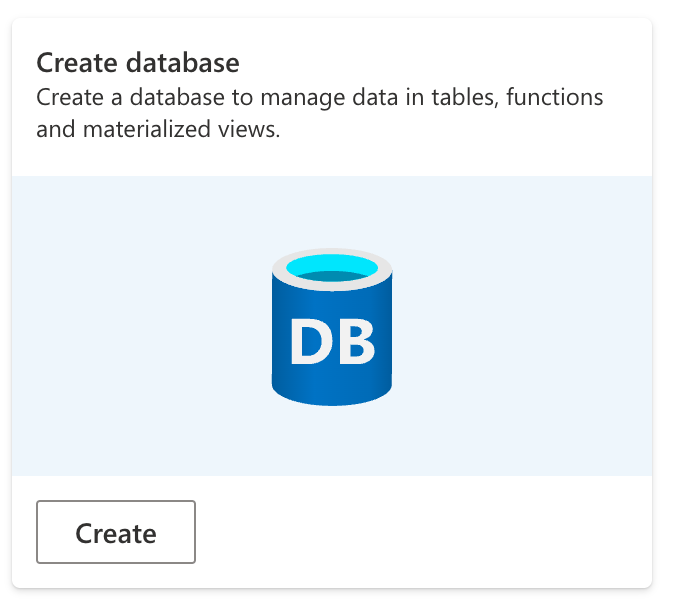
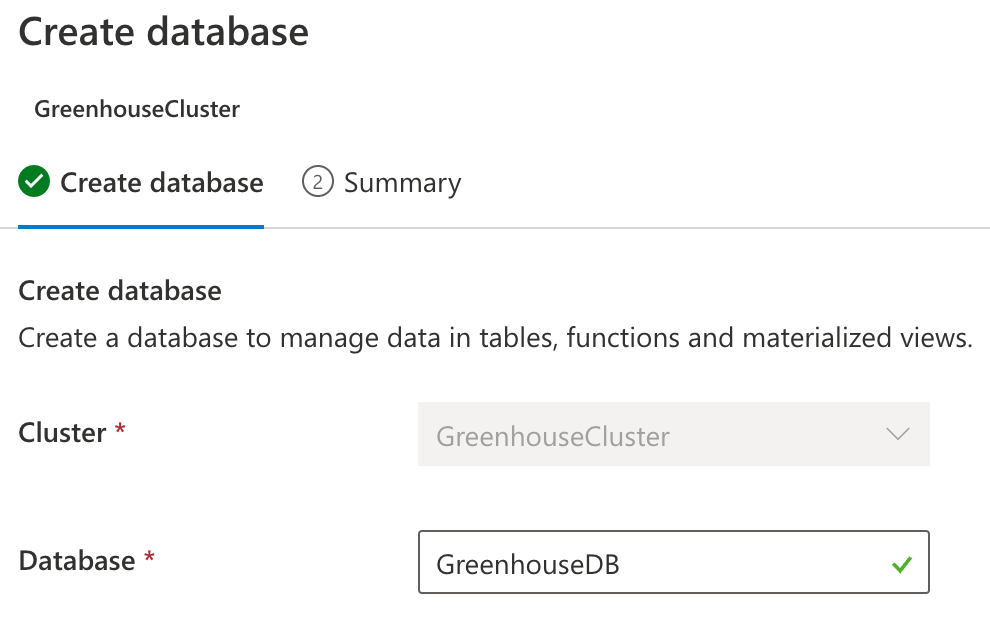
This will create what’s called a cluster. After that we need to create a database. This is totally free:
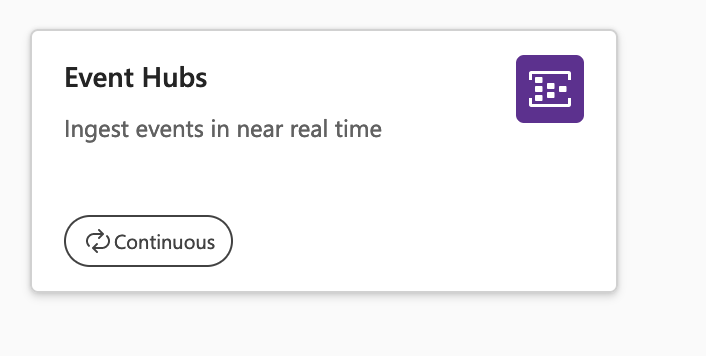
To create the connection, go to «Ingest data» and choose «Event Hubs»:

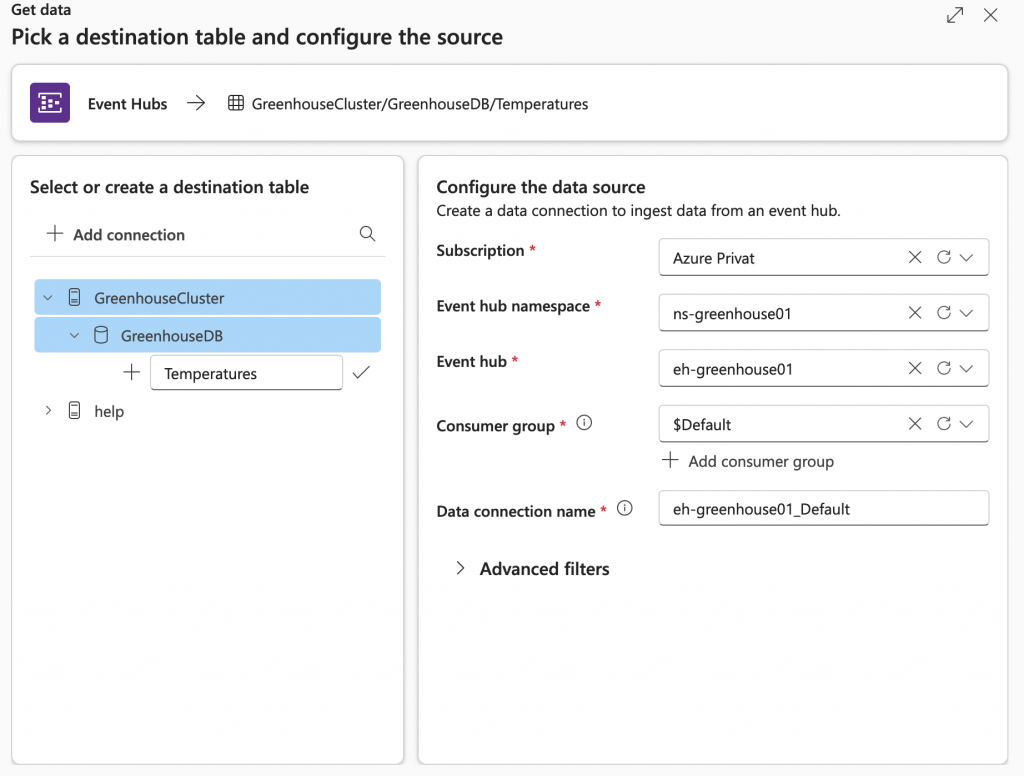
Create a table in your newly made database. When you’ve created your table you can choose your subscription and correct Event Hub-stuff. This is my example. When you are done, click «Next»:
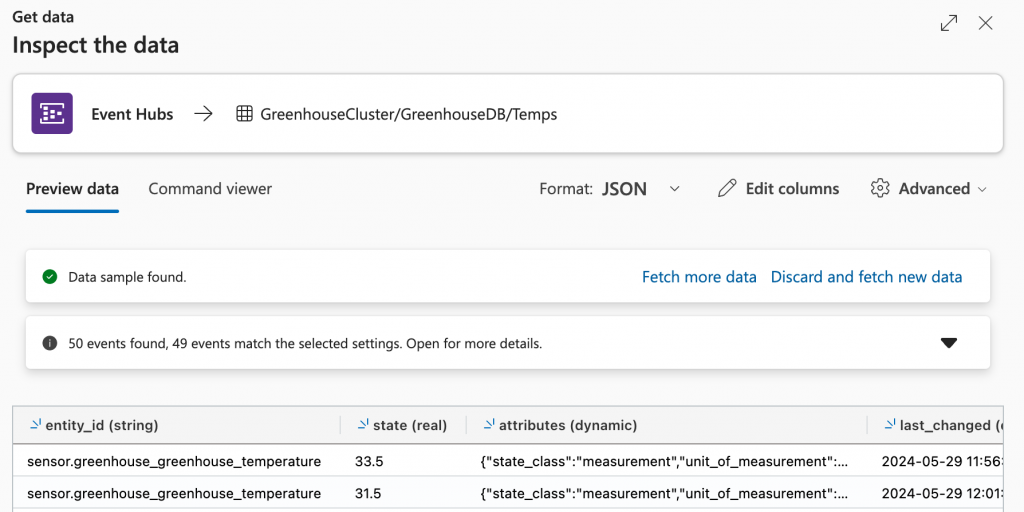
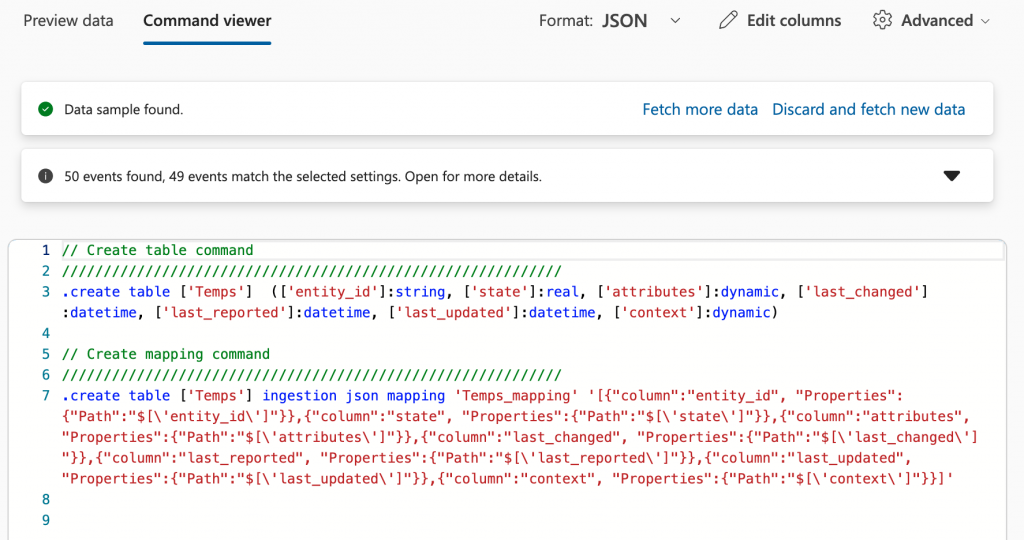
Here it will check for a connection and let’s you inspect the data. Under the Command viewer you can dictate how the table will be mapped. It will generate a suggestion based on the data from your Event Hub, but it’s always nice to have some control over the outcome. Click «Finish» and let Azure Data Explorer create a table with the mappings specified in your new database:
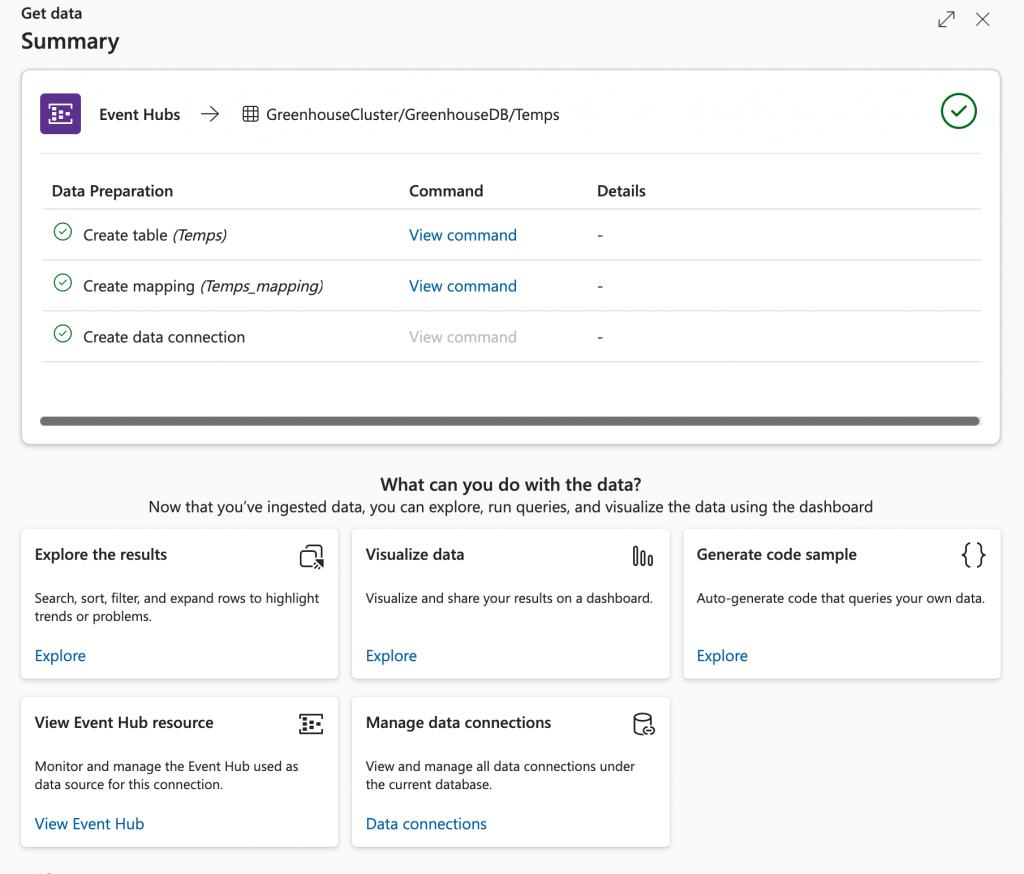
What do you want to do next? Explore the results? Visualize data? It opens up a ton of possibilites. Click «Close»
Now we can run some queries to our database and see if there’s any data available from Event Hub. Go to «Query» and select your freshly made database, and expand it so the table comes to view. Try to input a Kusto query to get data from the lates day (24 hours):
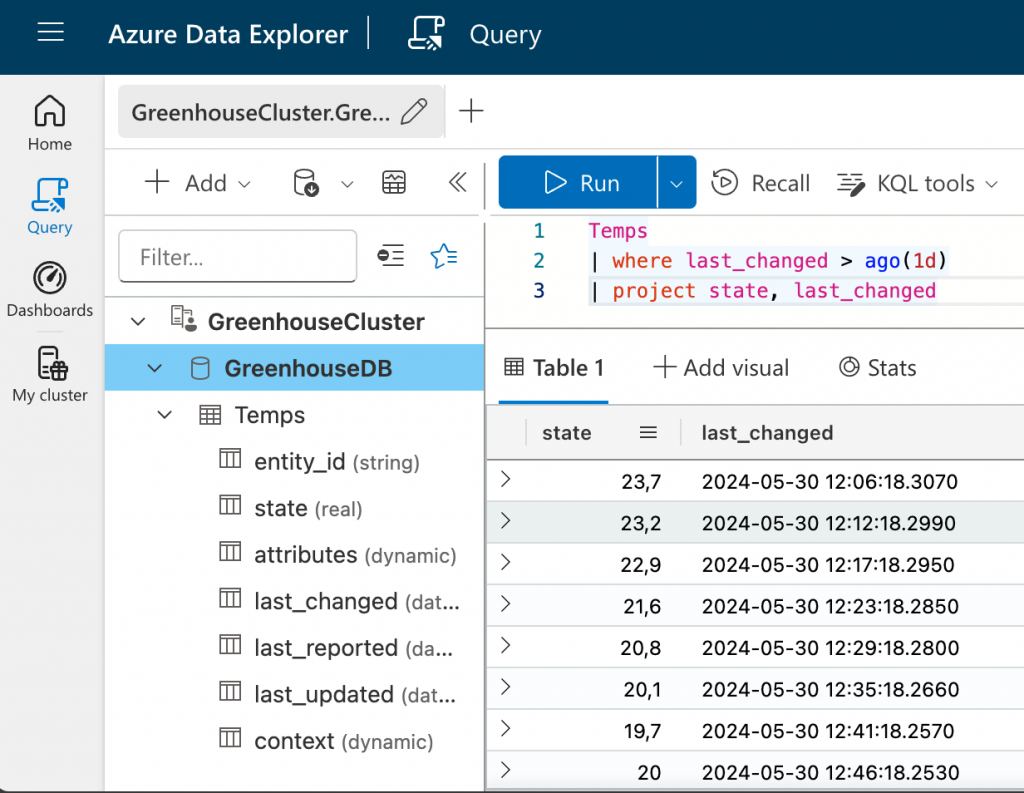
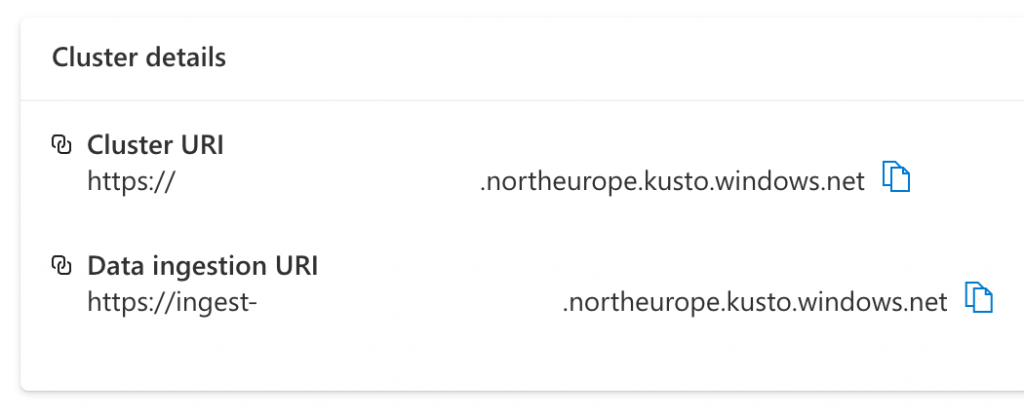
Looks good! State is the actual temperature, and we can see when it last changed. Now it’s time to view your data in a graphical manner. But first, grab your Cluster URI from the «My cluster» page:
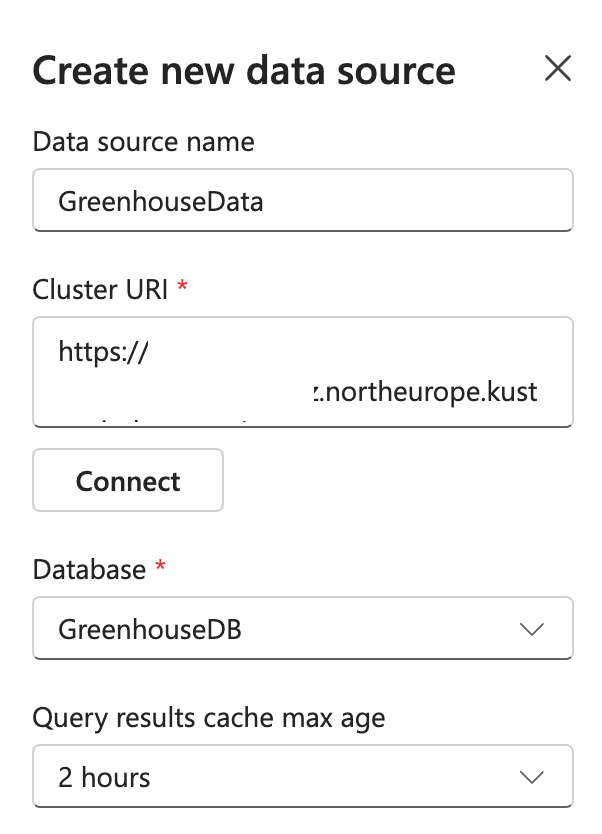
Then, go to «Dashboards» and click «Create new dashboard». Give it a name. Here’s a blank slate for you to play with. Click on «+ Add tile». Give that a name. When that’s done you can click on «+ Data source». Give it a name, paste your Cluster URI and press «Connect». Choose your database and select a cache max age:
You will then be presented with a code editor where you will be able to begin to craft your graphs. Why not reuse our Kusto query from earlier? What will happen?
Temps
| where last_changed > ago(1d)
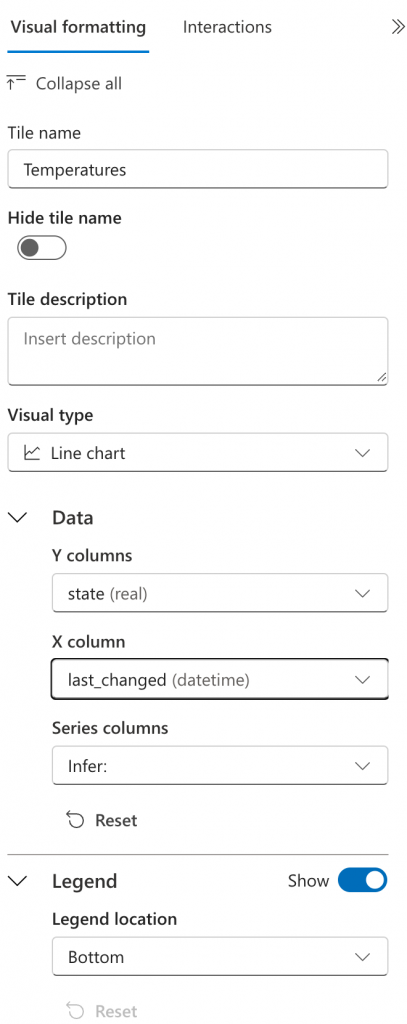
| project state, last_changedClick «Run». Did you get some results? Nice… Now we can create our graph (Finally!). Click «+Add visual» and fill inn all the fields like this. When you do this, all your changes are visualized live so you can see what’s changing:
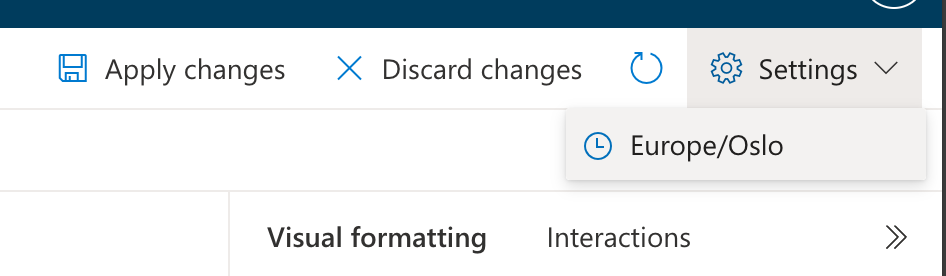
But before you go on and click «Apply changes», change your timezone to your local one:
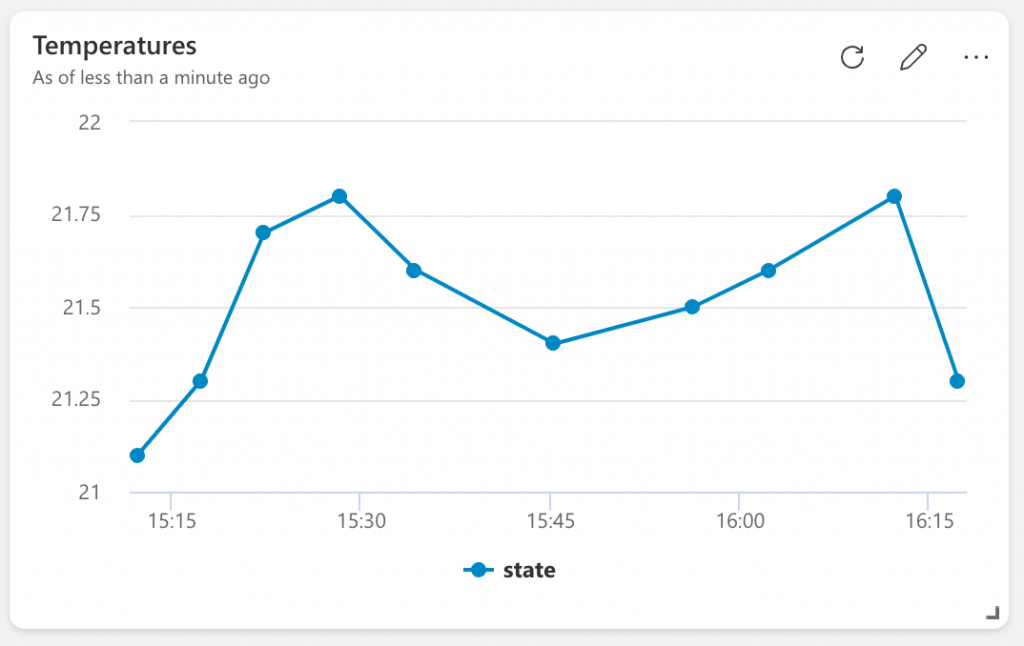
When you save, you are taken back to your dahsboard with your newly created tile showing a nice graph over the temperatures from the greenhouse:
Summary
Whoa! This has been a wonderful process, all from hardware and sensors to data and graphs in Azure. I’ve learned a lot by going through all these steps.
Not every step is so well documented as it should be. Have been scratching my head a couple of times before I figured stuff out. But we are not done yet! Next time we will store this data in a safe place. Was it Dataverse? Yeah I think so. Stay tuned!